
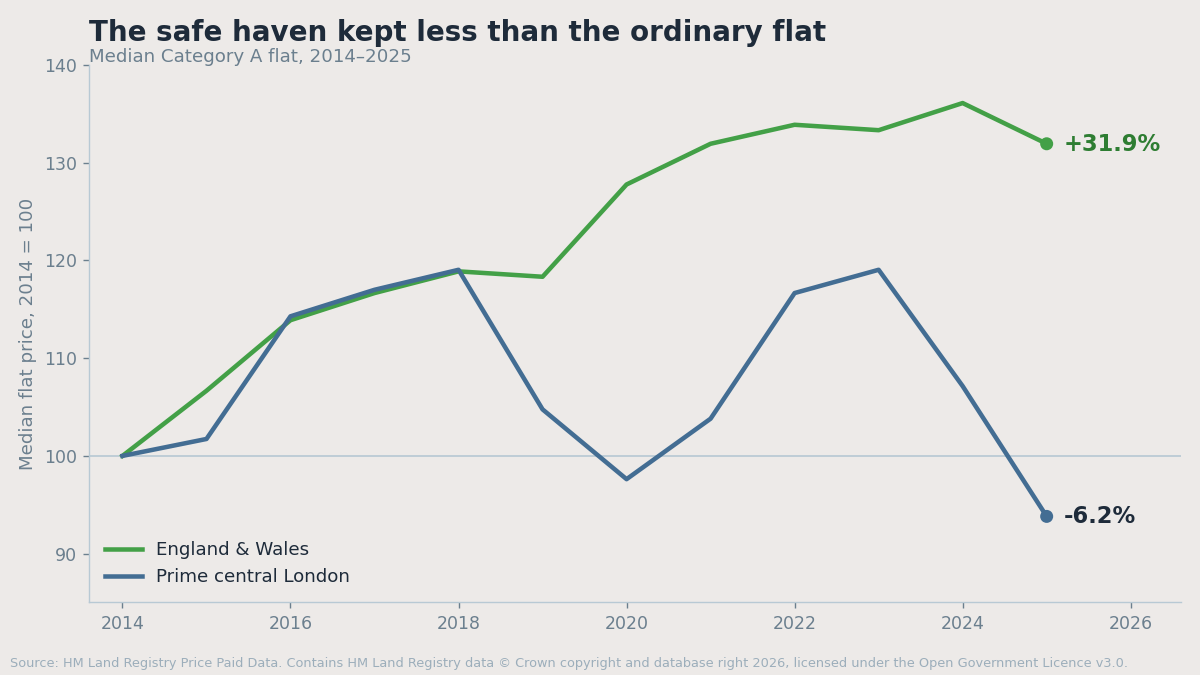
Prime central London flats lost 6.2% since 2014. Ordinary flats gained 31.9%.
The Intelligence — August 2026
In 2014 the median price paid for a flat in prime central London was
£1,050,000. In 2025, on the same source and the same filter, it was
£985,000.
Not lower in real terms. Lower in pounds.
Over the same eleven years the median flat across England and Wales rose from
£180,000 to £237,500 — a gain of 31.9 per cent. The market sold as the
place to protect capital lost 6.2 per cent of it in cash, while the market
nobody described that way at all gained nearly a third.
The claim being tested: prime central London as a store of value
There is a sentence that appears in almost every conversation about London
property, and it is so widely held that it is rarely said out loud any more —
it is simply assumed, the way you assume the floor. *Prime central London is a
store of value.* A safe haven. Capital preservation. The place money goes to
stop moving.
It is the entire justification for a price premium of roughly five times the
national median. The premium is not sold as a bigger flat. It is sold as
safety.
Prime central London flat prices, 2014 to 2025: the figures
| Series | 2014 median | 2025 median | Change | Indexed 2014 = 100 |
|---|---|---|---|---|
| Prime central London flats | £1,050,000 | £985,000 | −6.2% | 93.8 |
| England and Wales flats | £180,000 | £237,500 | +31.9% | 131.9 |
Transaction volumes over the same period, prime central London: 2,876
Category A flat sales in 2014, 1,546 in 2025.
Methodology
- Source: HM Land Registry Price Paid Data, complete file. Open data,
published under the Open Government Licence v3.0. Not a survey, not an index
built on asking prices — the price recorded on the deed for every
transaction.
- Period: calendar years 2014 and 2025.
- Property type: flats and maisonettes only.
- Transaction category: Category A only — standard, full-market,
arm's-length sales. Category B transfers (repossessions, transfers to
companies, buy-to-let portfolios and other non-market transactions) are
excluded.
- Geography: postcode districts W1, SW1, SW3, SW7, W8, SW10 and W11,
including all sub-districts. England and Wales figures cover the whole
dataset on the same type and category filters.
- Statistic: median price paid. Not mean, not mix-adjusted.
- Accessed: August 2026.
Do it yourself, and mind the trap
This section matters more than the numbers, so it comes before the argument
rather than after it.
Every figure in this piece can be checked by anyone, this afternoon, for
nothing. Price Paid Data is a free download. Filter it and see whether we are
telling you the truth. That is not a courtesy. It is the reason the finding is
worth anything: a number you cannot reproduce is a number you are being asked
to trust.
One warning, because it cost us an afternoon. If you filter the postcode
district by exact match on the list above — `W1`, `SW1`, and the rest — you
will get a much gentler answer: about minus 2.4 per cent, which is close
enough to flat that you might shrug and move on.
It is wrong. In the Land Registry data, `W1` and `SW1` never appear as
districts in their own right. They exist only as sub-districts: W1B, W1J, W1K,
SW1A, SW1X, SW1W. An exact-match filter silently drops every sale in Mayfair,
Marylebone, Fitzrovia, Belgravia, Westminster and St James's — and then
reports a prime-central-London figure calculated without prime central London.
Match on the district prefix, not the district string, and the number moves
from −2.4 per cent to −6.2 per cent.
We publish the trap because it produces a comfortable answer, and comfortable
answers are the ones nobody checks.
How our −6.2% compares with published market estimates
Our figure is the smallest fall of any published estimate we can find. That is
worth stating plainly, because a reader who follows this market will notice the
gap and is entitled to wonder whether we picked the convenient number.
- Coutts put prime central London at 10.3 per cent below its 2014 peak
at the end of 2025, with Knightsbridge and Belgravia 29.5 per cent under peak
and Chelsea 20.5 per cent down (London Prime Property Index, published
17 February 2026).
- Savills put London's most established prime postcodes at 24.5 per cent
below their 2014 peak at the end of 2025, after a fall of 4.8 per cent
during that year.
Four differences in construction account for the distance, and all four push
our number towards zero:
1. Peak versus calendar year. Both houses measure from the 2014 *peak*. We
measure the 2014 *annual median*, which is below the peak by construction.
2. Flats only. We exclude houses. The largest falls in this market have
been concentrated in the most expensive stock, which skews to houses.
3. Postcode districts, not a curated basket. Our seven districts include
their whole area. A prime index is weighted towards the specific streets
where the premium is largest — and where, on Coutts' own neighbourhood
figures, the fall has been three to five times ours.
4. Median of recorded sales, not a mix-adjusted index. We take the middle
transaction that actually happened. We make no adjustment for what changed
about the properties being sold.
We are not claiming ours is the better measure. It is the duller one: the
most conservative construction available on the most boring possible dataset.
The argument does not need the larger number. It needs the direction, and the
direction is the same at −6.2 as at −24.5.
The four years when the two markets were the same asset
The interesting part is not the size of the gap. It is when it opened.
Index both series to 100 in 2014 and they move together — not roughly, but
almost exactly. By 2018 prime central London stood at 119.0 and England and
Wales at 118.9. A tenth of a point apart, after four years. Whatever was
driving one was driving the other.
Then they part. England and Wales carries on to 131.9 by 2025. Prime central
London falls to 93.8, with two failed recoveries on the way — back to 119 in
2023, and down again.
That matters more than the headline, because it is the opposite of what a store
of value is supposed to do. A safe haven is meant to behave *differently* from
the ordinary market: to hold when the ordinary market falls. This one tracked
the ordinary market while conditions were benign, then underperformed it when
they were not. It did not decouple. It stopped.
Why the belief survives the evidence
The data has been public throughout. The belief has not weakened. That
combination usually means the belief is doing a job the data cannot interfere
with, and here there are four mechanisms holding it in place.
It was never bought as a return. A premium paid for capital preservation is
an exit from volatility, not a bet on growth. The owner's test is therefore not
*did it beat an index* but *did it stay where I put it* — and a holding
acquired in order to stop thinking about it is a holding nobody marks to
market. There is no quarterly statement. Nothing arrives to contradict it.
Illiquidity conceals the very fall it causes. Volumes in these seven
districts halved between 2014 and 2025. Fewer transactions means fewer public
marks, and in a market that turns over slowly, *prices have not fallen* and
*prices have not been tested* look identical from the outside. The mechanism
that produced the decline is the same mechanism that hides it.
Every fall has an available second frame. Sterling. Stamp duty. Non-dom
rules. The Budget. Each is a real factor and each is also an off-ramp — a way
to classify the loss as a temporary distortion of the price rather than
information about the asset. A belief with an unlimited supply of exceptions is
not falsifiable by a single year, and the years arrive one at a time.
The asset is consumed as well as owned. It is a home, an address, a
position. Utility that is enjoyed continuously is not weighed against a capital
number that is only observed on sale. Most of the return is being received in a
currency the spreadsheet does not record.
None of these are errors of reasoning. They are the reasons a proposition can
be tested, fail, and remain in place — which is a more useful thing to
understand than the fact that it fails.
Two objections, answered
*The mix changed.* It did — the halving of volumes is in the figures above.
Fewer transactions, and a different set of them. But that cuts against the
safe-haven case rather than for it: an asset whose market halves in a decade is
not behaving like a store of value. It is behaving like something with fewer
and fewer people willing to hold it.
*It held up in dollars.* Perhaps. But it was not sold as a currency trade. It
was sold as capital preservation, in sterling, to people who bank in sterling.
Questions and answers
Did prime central London property fall in value between 2014 and 2025? Yes. On HM Land Registry Price Paid Data, the median Category A flat price across the seven core prime districts fell from £1,050,000 in 2014 to £985,000 in 2025 — a fall of 6.2 per cent in nominal terms, before inflation.
How does that compare with the rest of England and Wales? The median Category A flat price across England and Wales rose from £180,000 to £237,500 over the same period, a gain of 31.9 per cent. Indexed to 2014, the two series end 38.1 points apart — 131.9 against 93.8.
Why is this figure smaller than the ones published by Coutts and Savills? Because it is measured from the 2014 calendar-year median rather than the 2014 peak, covers flats only, uses whole postcode districts rather than a curated prime basket, and takes an unadjusted median of recorded sales. Every one of those choices makes the fall look smaller. Coutts reported 10.3 per cent below peak at the end of 2025; Savills reported 24.5 per cent.
When did prime central London stop tracking the wider market? In 2018. Indexed to 2014, both series stood within a tenth of a point of each other that year — 119.0 against 118.9. They diverged from that point.
Can these figures be reproduced independently? Yes. Price Paid Data is published free by HM Land Registry under the Open Government Licence. The filters required are listed in the methodology section above. Note that matching postcode districts by exact string rather than prefix excludes Mayfair, Marylebone, Fitzrovia, Belgravia, Westminster and St James's, and returns approximately −2.4 per cent instead.
---
*Chart: our own, from the series above. Median Category A flat price indexed to
100 in 2014.*
*Sources: HM Land Registry Price Paid Data, complete file, accessed August 2026.
Median price of Category A flat transactions. Prime central London defined as
postcode districts W1, SW1, SW3, SW7, W8, SW10 and W11, including all
sub-districts. England and Wales figures cover all Category A flat transactions
in the dataset. Comparative estimates: Coutts London Prime Property Index,
published 17 February 2026, covering end-2025; Savills prime central London
research, covering end-2025.*
*Contains HM Land Registry data © Crown copyright and database right 2026. This
data is licensed under the Open Government Licence v3.0.*
Sources
- HM Land Registry — Price Paid Data (Open Government Licence v3.0)
- Coutts — London Prime Property Index, published 17 February 2026
Frequently asked questions
Did prime central London property fall in value between 2014 and 2025?
Yes. On HM Land Registry Price Paid Data, the median Category A flat price across the seven core prime districts fell from £1,050,000 in 2014 to £985,000 in 2025 — a fall of 6.2 per cent in nominal terms, before inflation.
How does that compare with the rest of England and Wales?
The median Category A flat price across England and Wales rose from £180,000 to £237,500 over the same period, a gain of 31.9 per cent. Indexed to 2014, the two series end 38.1 points apart — 131.9 against 93.8.
Why is this figure smaller than the ones published by Coutts and Savills?
Because it is measured from the 2014 calendar-year median rather than the 2014 peak, covers flats only, uses whole postcode districts rather than a curated prime basket, and takes an unadjusted median of recorded sales. Every one of those choices makes the fall look smaller. Coutts reported 10.3 per cent below peak at the end of 2025; Savills reported 24.5 per cent.
When did prime central London stop tracking the wider market?
In 2018. Indexed to 2014, both series stood within a tenth of a point of each other that year — 119.0 against 118.9. They diverged from that point.